Circular objects in Poiseuille flow
Comparison with the reference data by Chen et al., Phys. Fluids (24), 2012 is described, who simulated multiple cylindrical objects in plane Poiseuille flows.
Configuration
We consider a rectangular domain (\(l_x = 1, l_y = 4\)), in which \(72\) circular objects (whose radius is adjusted so that the total volume fraction leads \(16.9\%\)) are positioned randomly. An analytical Poiseuille flow profile is given initially, while the particles are at rest. The liquid viscosity (Reynolds number) and the driving force are adjusted so that the maximum velocity when objects are absent (single-phase condition) leads \(1\) and the bulk Reynolds number \(Re = l_x U_{max} / \nu\) leads \(1000\). The spatial resolution is fixed to \(256 \times 1024\), and \(1000\) simulation time units are simulated.
In practice, the configuration is specified as follows:
#!/bin/bash

## directory name containing flow fields to restart
# export dirname_restart=

## durations
# maximum duration (in free-fall time)
export timemax=1.0e+3
# maximum duration (in wall time [s])
export wtimemax=8.6e+4
# logging rate (in free-fall time)
export log_rate=1.0e-1
# logging after (in free-fall time)
export log_after=0.0e+0
# save rate (in free-fall time)
export save_rate=1.0e+2
# save after (in free-fall time)
export save_after=0.0e+0
# statistics collection rate (in free-fall time)
export stat_rate=1.0e-1
# statistics collection after (in free-fall time)
export stat_after=2.0e+3

## domain
# domain lengths
export ly=4.0e+0
# number of grids
export itot=256
export jtot=1024

## dt safe factors, adv and dif
export safefactor_adv=0.95
export safefactor_dif=0.95

## physical parameters
export Re=1.0e+3

## external forcing in y direction
export extfrcy=8.0e-3

mpirun -n 4 ./a.out
Results
A snapshot of the flow field (velocity magnitude) and the instantaneous particle locations are visualised.

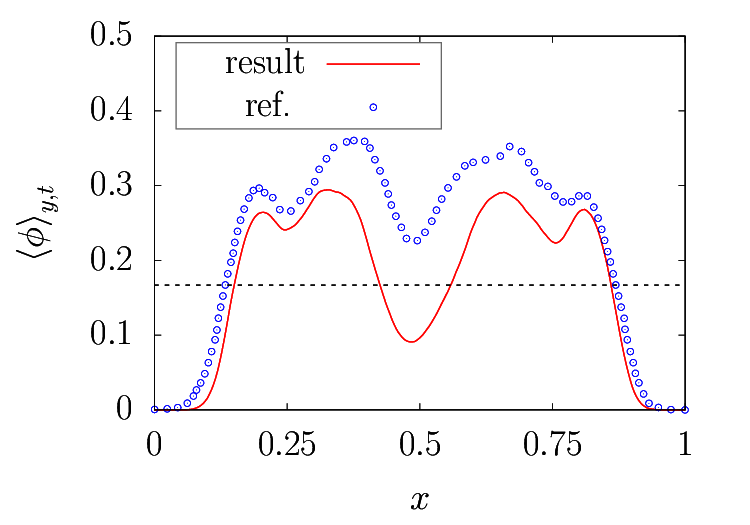
The averaged volume fraction \(\left\langle \phi \right\rangle_{y,t}\) as a function of the wall-normal position is plotted as well as the reference by Chen et al., Phys. Fluids (24), 2012, which is computed in src/statistics/collect.c.
The dashed line indicates the total volume fraction (\(16.9\%\)), i.e., the integral of the red line should give this value.
A qualitative agreement (e.g., number of peaks, low concentration in the vicinity of the walls and the channel center) with the reference result is observed.
